hsbExport | How to export to Excel
This document will show you how to export to Excel.
The module hsbExcel enables you to export data from hsbdesign to Microsoft Excel.
The user can configure multiple reports with a set of worksheets which could reflect various bills of materials with multiple sub report
Export Data
Run the command HSB_EXPORTTOEXCEL
OR select the Excel icon in the Ribbon.

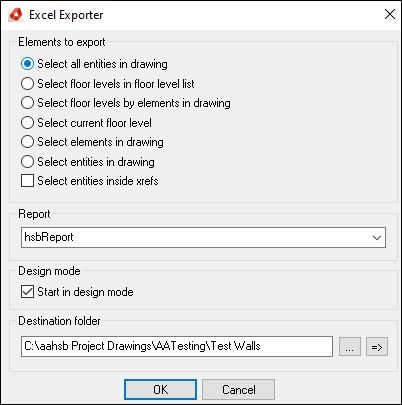
To export data to Microsoft Excel use command Excel from the output menu and select one of the options to pre-select certain entities or collection of entities.
All available reports will appear in the dropdown list Report.
The report hsbReport is a predefined report and will be generated when you run this command the first time.
- Select a report and press OK.
The program will export all selected entities as defined in the report and will automatically launch Microsoft Excel.
If you check the option Start in design mode the program will launch the Excel Report Designer
Excel Report Designer
To start the Excel Report Designer fire the command HSB_EXPORTTOEXCEL and select the option Start in design mode.
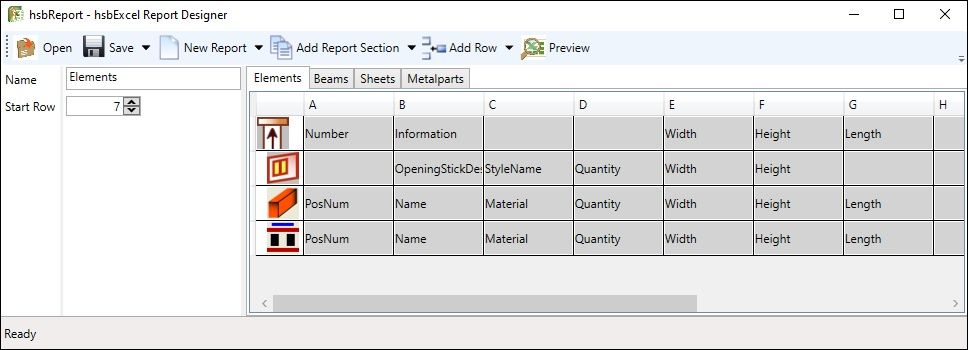
Open - Use this command to open an existing report on your hard disk. The program searches for any valid report definition in the path hsbCompany.

Save Report - This command saves the actual report to disk.
Save Report as - This command and saves the actual report into the path hsbCompany>\excel\<reportName>
New Report - This command creates a blank new report with a default section. Use the command Add Row to specify output types.
Specify the row where the first row of data should be written.
New Report from template - This command creates a new report based on a Microsoft Excel template. It will create sections based on the existing sheets of the selected template.
The template must follow certain conventions to support all features.
Use the command Add Row to specify output types and the program will add columns where the Display Name is already set to the value given in your template.
Add Report Section - This command creates a new section of the report. A section expresses the report structure of one worksheet in Microsoft Excel. If the report is not based on a template and the section name cannot be found as worksheet name the corresponding sheet will be created during export. It is recommended to use a template to obtain all features of the hsbcad Excel Export.
The sub entries of this menu will create a new section with the given type name.
Use the command Add Row to specify output types.
hsbcad also supports the definition of child rows on certain entity types such as elements.
Remove Report section -This command removes a section from an existing report.
Add Row - This command adds a row definition to the selected section. A row definition declares the type of entity to be exported and may contain multiple columns of properties to be exported. On a row definition one can define a query to filter certain data of the selection set.
A row definition sets the appearance of a row of data in Microsoft Excel.
All entities of the selected type will use the same row definition to contribute their data to multiple rows in a worksheet.
Each row definition uses four formatting rows of the template.
Supported Entity Types
The following entities and its properties are supported for data output. Entities marked with a (+) do support child entities.
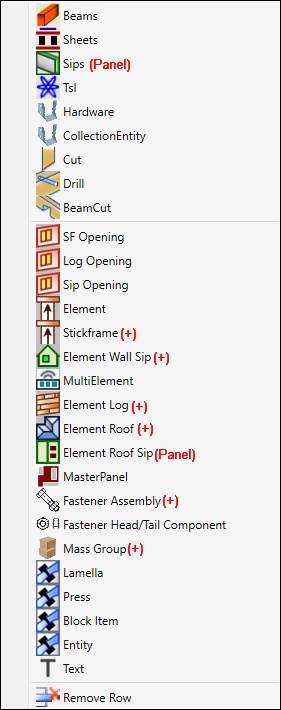
Remove Row - This command will remove a row from the current section.
Add Column - This command adds a column. A column is visualized as a grey cell where one can select properties which apply to the selected entity type of the row.
The column definition also contains options to order the entity in a certain sequence as well as to control the unit type.
The sort index determines the priority of the sorting in respect of multiple columns having sorting criteria.
The sorting direction distinguishes if the data needs to be sorted ascending or descending, i.e. if you want to order a report by material and then by the width the column for the material would have the sort index 1 and the column width will have the sort index 2.
The sort direction can be set for both columns individually as requested.

The sum of a column can be evaluated when the option sum is selected from the property Summary Type.
It will insert a sum formula after the last data set of the selected row.
The format of this sum can be controlled by the fourth format row in the template definition.
Child Rows
A Child Row expresses the relation to the parent entity, i.e. an element typically has element specific data such as length, height and width of the element but it may also contain child entities such as beams, sheets etc. Those entities will have different properties and will be exported in relation to the given element when defined.
The two listings below explain the exported data structure if you append the four rows Element, Opening, Beam and Sheet to a section as child rows to the first one and as four parent rows.
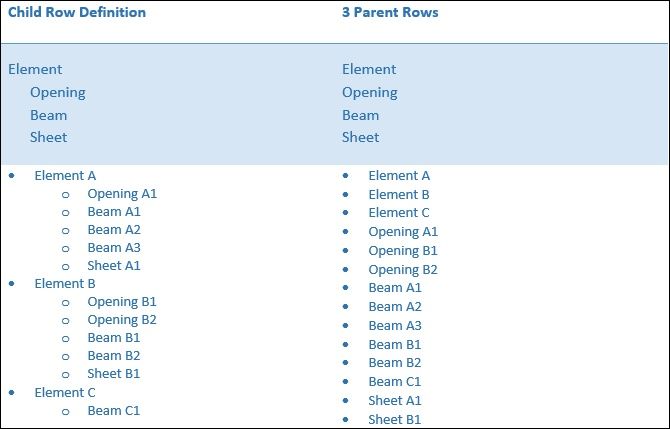
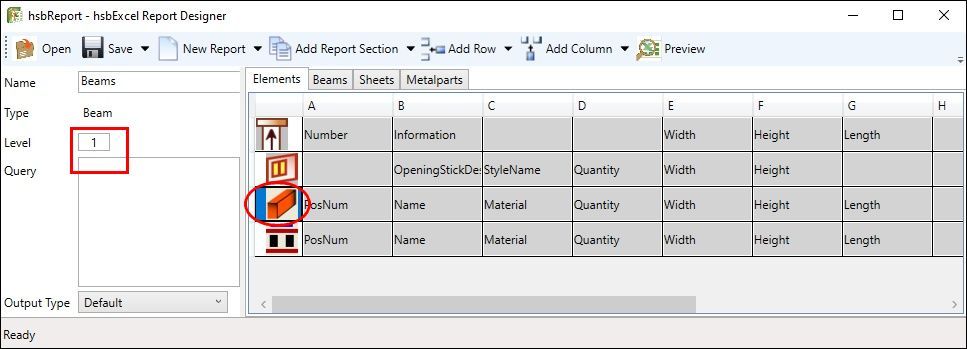
If a row is selected in the cell of the row icon the newly added row is defined to be a child row. A child row is visualized by an indentation to the previous row.
The level of the child row is expressed as integer of a row definition.
0 means it is a parent row, 1 means it is a child row that depends on 0 etc.
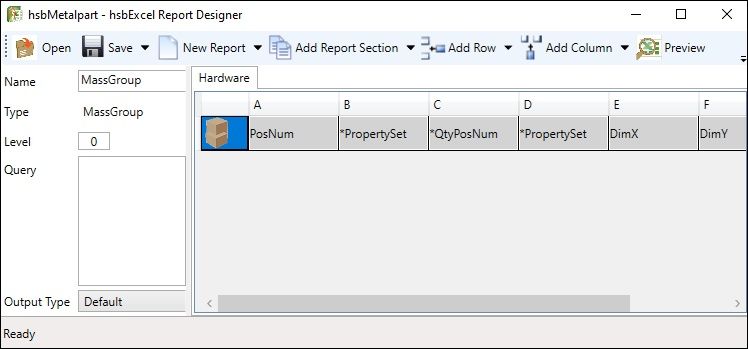
Child Row Mass Group
A child row of a mass group is by definition also a mass group. To distinguish between parent and child mass groups one needs to use a query on the parent mass group to ensure that child mass groups will not be displayed. Simply add ! IsChild to the query field of the row.

Display Name - The property Display Name is only meant to display a custom name in the designer, i.e. if one declares cells without any property or if the property name itself seems to be not meaningful enough.
If you wish to modify the column header which will displayed in your excel file you can do this in your template.
Embrace the value with the characters || and it will be translated if it can be found in the translation table.
Example |Width| should be displayed as translated value to your current hsbcad Language.
Properties - Each supported entity has a set of properties which the user can select to output. Some of these properties are not ‘real’ properties of the entity but they are derived from other conditions such as being linked to an element. These ‘virtual’ properties are identified by its dependency followed by a ‘.’ and the property name. I.e. a beam could have a virtual property Element Number which would return the number of the element where this beam is potentially linked to. Other special properties are indicated by a * in front of the property name.
*Properties - *Properties are specific properties which do not necessarily apply to each entity. If they apply the corresponding data will be written.
In order to define a report with any extended *Property such as the *PropertySet or *TslProperty one has to make sure that the selection set which is used during report setup contains entities with the required properties.
It is not possible to obtain those properties if no matching entity can be found in the selection set.
*QTY
This property returns the quantity of identical items. It respects the full accuracy of geometry data as well as all describing properties.
*QTYPosNum
This property returns the quantity of identical items based on the posnum generation of hsbcad. Due to geometrical tolerances it might occur that i.e. two items vary by 0.1mm in length and still will receive the same posnum. QtyPosNum would not consider the geometrical difference but the identical posnum to report the quantity of this item.
*PropertySet
Property Sets are a very flexible and powerful tool in ACA to assign and obtain extended data of an entity. Please read the ACA documentation to learn more about PropertySets in ACA.
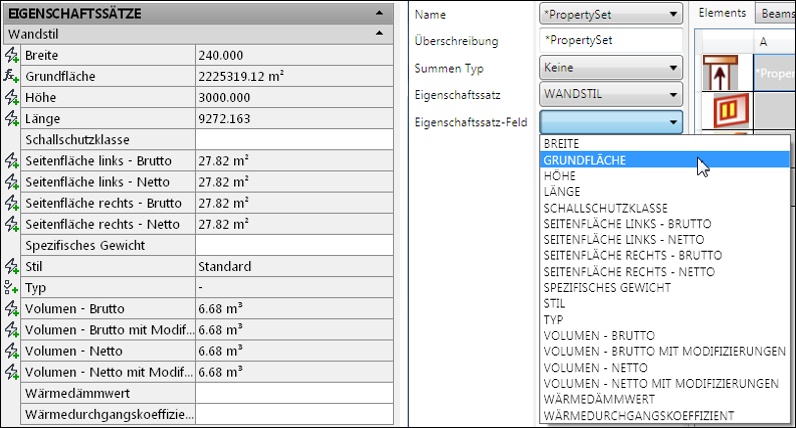
If one selects the *PropertySet and the selected item contains a property set one can choose of any property of this set. The images below show the properties of a wall with a property set called ‘Wandstil’ in ACA and in the report designer.
Note: only property sets which are defined by object are supported.
*TslProperty
By definition a *TslProperty is only available for TSL’s. It reflects all properties which are populated by a tsl as well as all properties which the tsl author has published as special output properties (U_xxx).
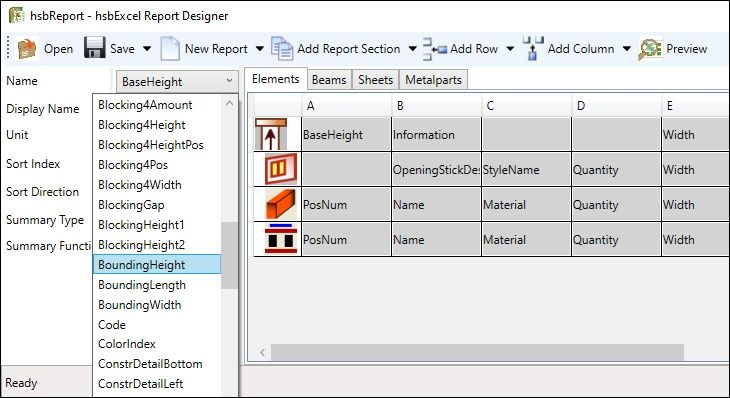
BoundingLength, BoundingWidth, BoundingHeight
These properties are available for elements only and reflect the dimension of the element by its containing beams, sheets and panels.
If one of these properties is used you have to select the beams, sheets and/or panels of the corresponding element.

Remove Column - This command removes a column from the actual row.

Preview - This command launches Microsoft Excel and creates an Excel Export based on the current report definition
Excel Template
A report can be created with or without an Excel Template. Using a template offers various additional options to design a report such as using customized logos, symbols, fonts, formatting etc.
The template is also used to define project variables like project name, project street etc.
Conventions
A few conventions apply to the template if you wish to customize your reports.
The template must consist of two named ranges which define the range of the header of a worksheet and the first row of the sheet where data will be written to. This must be done in every worksheet which you want to process by the excel export.
If you design your report using the report designer, all files referring to the report definition will be copied and renamed to a folder in <hsbCompany>\Excel.
A valid report definition consists of two files: the report definition with the extension *.erp and your template *.xltm or *xlsx. The files will receive the same name as your report, i.e. a report named StandardBOM will be saved as folder <hsbCompany>\Excel}StandardBOM and will contain StandardBOM.erp and StandardBOM.xltx (using Excel 2010).
Note: do not copy other files to this folder. Do not rename files as folder names and file names have to be in sync.
Header
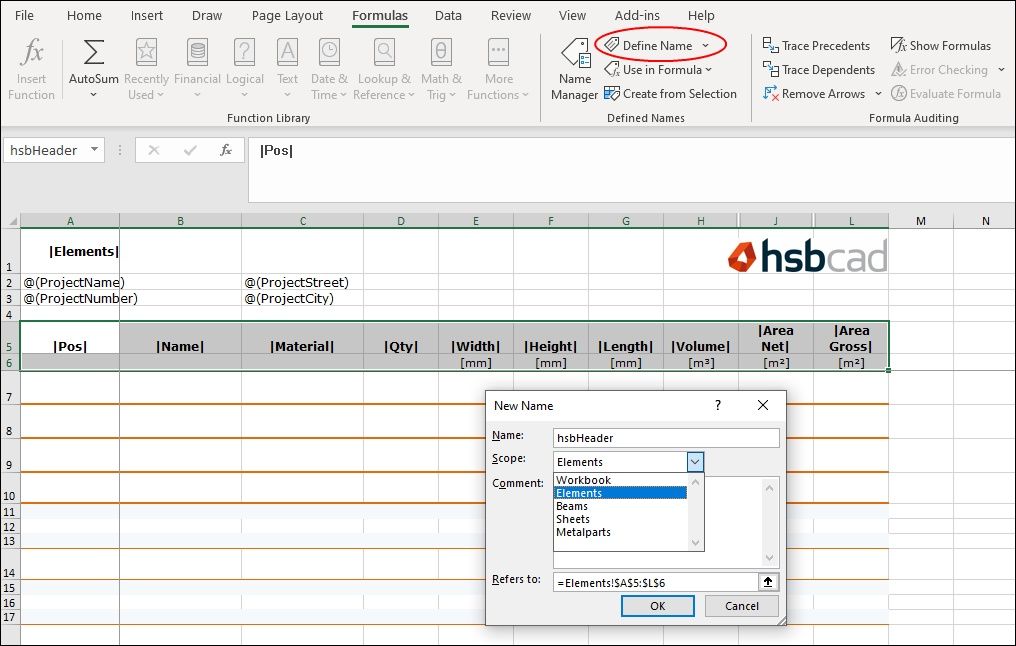
The range of the header must be named hsbHeader. It can consist of multiple rows where the header of each column must be defined in the first row of the range.
Since the content of every cell in the first row of the range is defining a header name one should not have empty cells in this range.

The range of the header can also contain a row which displays the units of a column. This must follow the conventions to declare a unit in a template.
How to name a range:
- Select the range of cells which contain the header information
- Enter the name of the range
- Select the worksheet where this name should apply to. Make sure the name is not defined to the workbook itself as the named range can appear in multiple worksheets with the same name
- Press OK to assign the named range.
First data row
The range of the first row of data must be named hsbFirstData. This range is used to identify the first row of data.
Follow the instructions of the hsbHeader to define the named range hsbFirstData.
Formatting
The entire formatting is based on the template and can be adjusted with the common commands of Microsoft Excel. In order to define sophisticated reports the format of a row definition is based on four rows.
Each set of four rows starting from the row of first data build the format rules for a row definition.
Format Row

The images below show the formatting of a report section which is made of one parent row (Element) and three child rows (Opening, Beam, Sheet) and the appearance of the report.
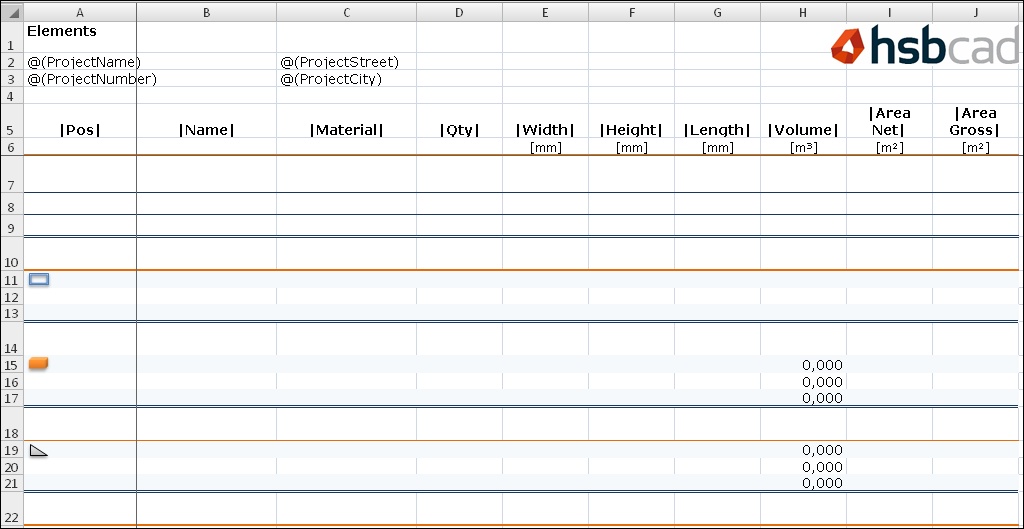
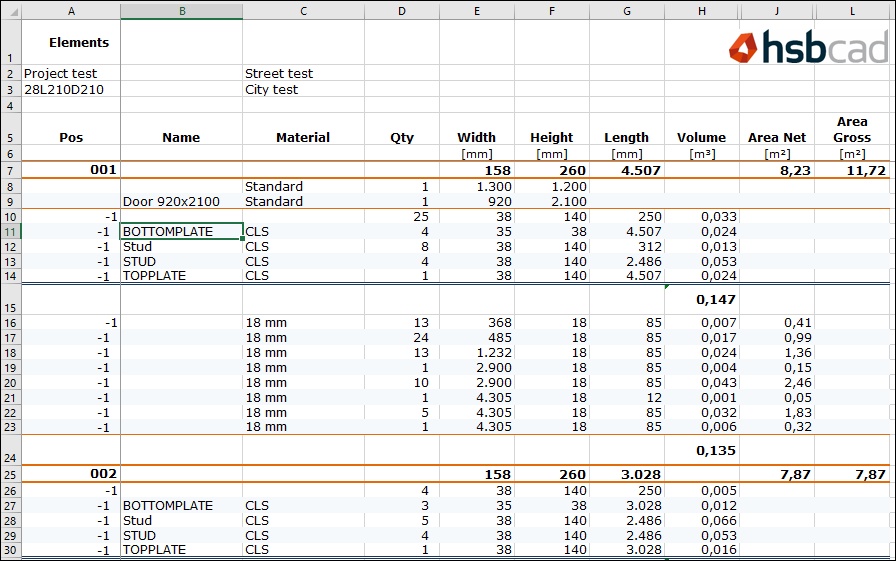
Note: the sample above uses conditional formatting which has a higher priority over regular formatting. This could mean that if a conditional formatting rule applies that the format seen in your template does not reflect the result in your export. There for it is recommended to write some dummy data in your template while defining it.
Constants, Formulas and Shapes
Each cell of a formatting row of a template may have constants or formulas, i.e. cell H15 in the image above has the formula =D13*E13*F13*G13/10e9 to calculate the volume of the bounding box of a beam.
Any function of Microsoft Excel can be used to perform special calculations in your report. Columns may be set to hidden if certain columns are used for calculations but are not relevant for the display, i.e. if you want to see the length of a beam in steps of 5cm you would use the function ceiling on the exported length and hide the column where the length is written to.
For a better readability of a report it might be useful to use symbols, graphics or shapes to visualize the exported data. The standard hsbcad report (sample above) uses different shapes in the first formatting row of all child row definitions. Shapes and other graphics should be linked to the cell position only.
Project Variables
This feature allows the properties of Projects to be formatted inside a string. The format string is made up of constant text and variables. The variables take the form:
@(<VariableName>)
The variable names directly relate to the property names of the classes so any string, number, enumeration or boolean property can be specified. If the variable name cannot be found it will not be resolved and will stay inside the format string unchanged.
The following variables are available to query the project information and refer to the hsbSettings.
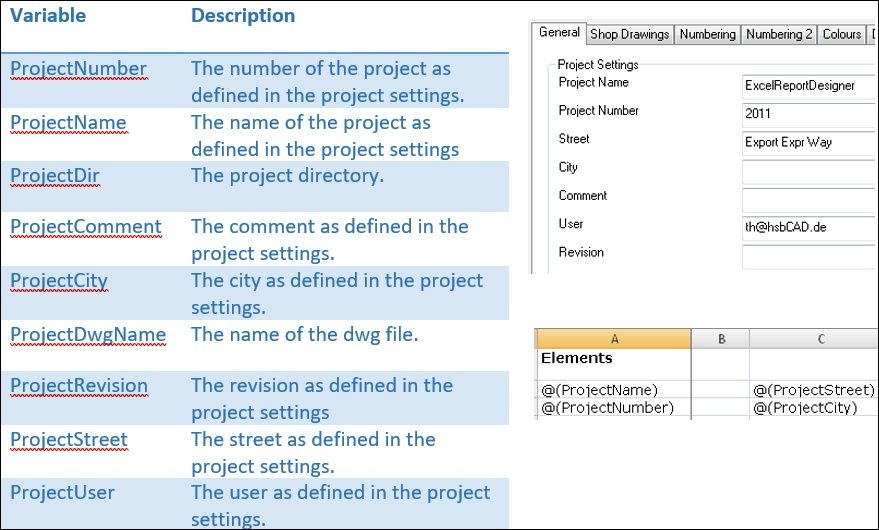
The project variables can be placed in any cell of the sheet and will be replaced by the program at creation time of the report. The sample above defines the Project Name to be written in cell A2, the Project Number to be written in cell A3 et
Query
The Query can parse any expression and evaluate the result, including static or dynamic parameters and custom functions. It can be used set a filter on a row definition, i.e. query (Type = 'SFTopPlate' or Type = 'SFBottomPlate') and Length > 2000 will only write beams which are of type Stickframe Top Plate or of type Stickframe Bottom Plate and are longer than 2000mm.

- Operators: available standard operators and structures
- Values: authorized values like types, functions
- Functions: list of already implemented functions
Operators
Expressions can be combined using operators. Each operator has a precedence priority. Here is the list of those expressions priority.
- primary
- unary
- power
- multiplicative
- additive
- relational
- logical
Logical -These operators can do some logical comparison between other expressions:
- or, ||
- and, &&
- true or false and true
The and operator has more prioroty than the or, thus in the example above, false and true is evaluated first.
Relational
- =, ==, !=, <> 1 < 2
- <, <=, >, >=
1 < 2
Additive
- +, - 1 + 2 - 3
Multiplicative
- *, /, % 1 * 2 % 3
Unary
- !, not, -, ~ (bitwise not) not true
Primary
Values
A value is a terminal token representing a concrete element. This can be:
Integers
They are represented using numbers. 123456
They are evaluated as Int32.
Floating point numbers
Use the dot to define the decimal part. 123.456
They are evaluated as Decimal. .123
Scientific notation
You can use the e to define power of ten (10^). 1.22e1
They are evaluated as Double 1e2
1e+2
1e-2
.1e-2
1e10
Dates and Times
Dates and times must be enclosed between sharps. #2008/01/31# // for en-US culture
They are evaluated as DateTime of the current Culture.
Booleans
Booleans can be either true or false true
Strings
Any character between single quotes "'" is evaluated as String. 'hello'
You can escape special characters using \\, \', \n, \r, \t.
Function
A function is made of a name followed by braces, containing optionally any value as arguments.
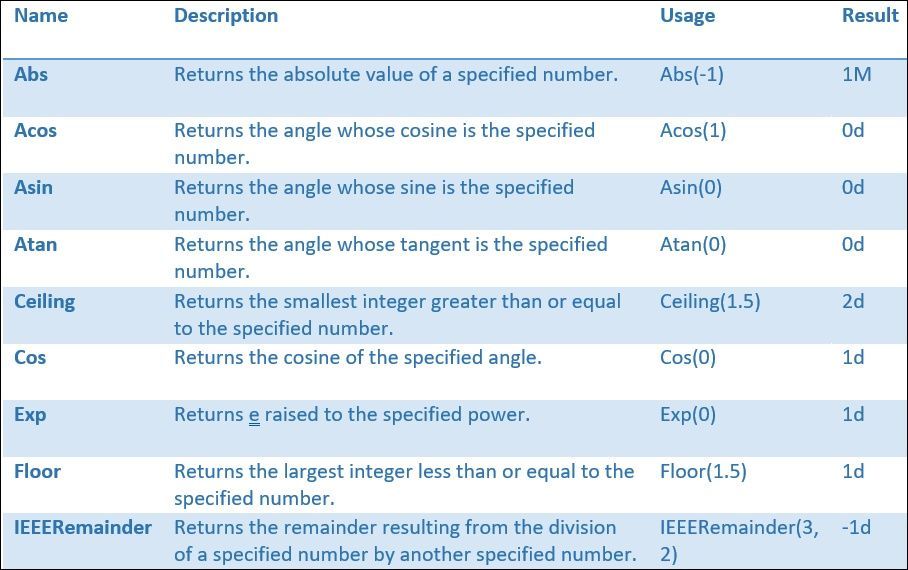
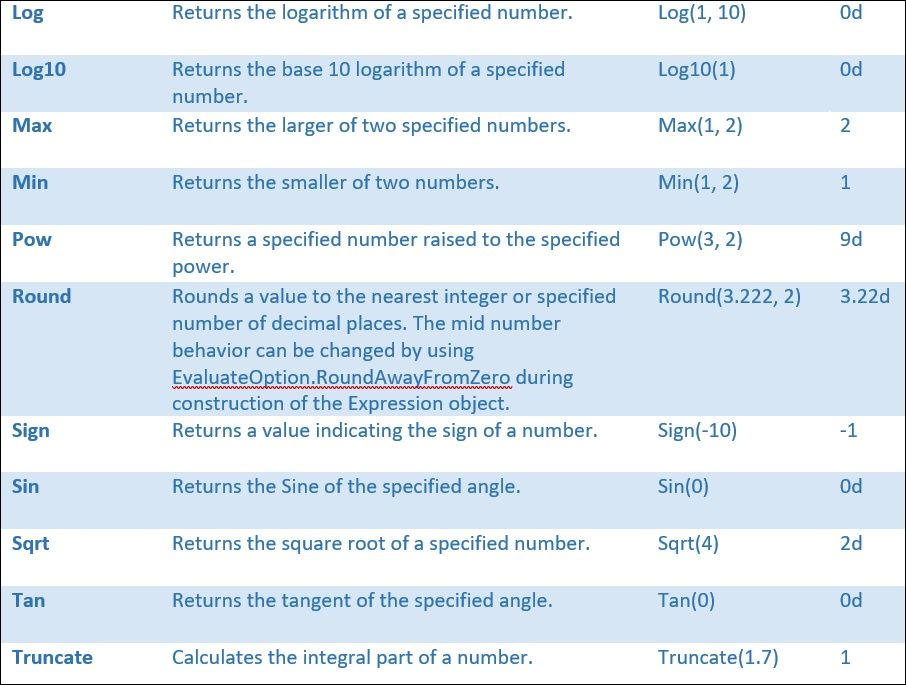
Abs(1), doSomething(1, 'dummy')
Please read the functions page for details.
Parameters
A parameter as a name, and can be optionally contained inside brackets.
2 + x, 2 + [x]
Please read the parameters page for details.
Functions
The framework includes a set of already implemented functions.
